Platform — Network Operations
Live Station Health. Automated Remediation.
Live station health heatmaps, session monitoring, and auto-remediation playbooks for common OCPP fault codes. Fault events are triaged automatically — your operations team sees actionable alerts with station context, not raw OCPP error codes from firmware they didn't write.
NOC Dashboard
One View Across Your Entire Network
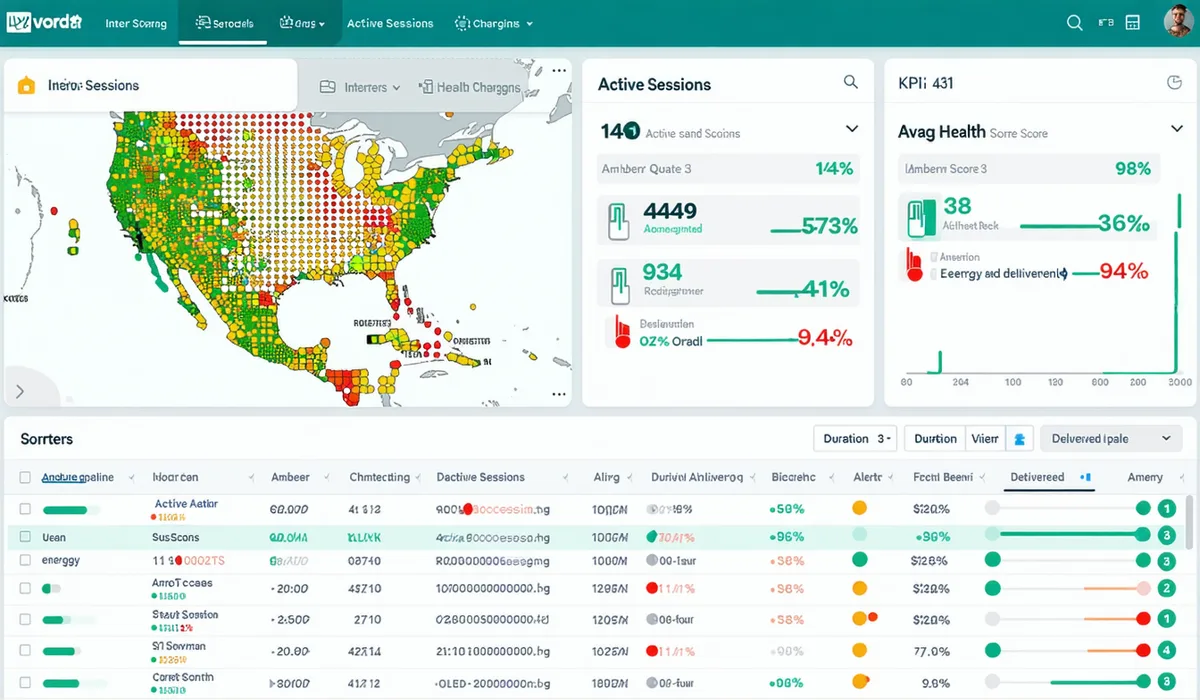
The Emobi NOC dashboard gives operations teams a real-time view of station health, active sessions, and alert queues — without switching between vendor portals.
Core Features
NOC-Grade Operations for Every Scale
Station Health Heatmap
Geographic view of your entire station fleet with color-coded health scores. Spot problem clusters before customer complaints surface.
Live Session Monitor
Real-time table of all active charging sessions with energy delivered, duration, and connector status. Export for billing reconciliation.
Smart Alert Queue
Fault codes, offline stations, and session errors are triaged and prioritized automatically. Your team sees actionable alerts, not raw OCPP error codes.
Auto-Remediation Playbooks
Configure automated responses to common faults: remote reset, firmware reboot, connector unlock. Resolve the 80% of issues that don't need human intervention.
Uptime Analytics
Station-level and network-level uptime reports with trend analysis. SLA compliance reports for your network or your customers.
Webhook Notifications
Push alerts to Slack, PagerDuty, email, or your own systems via configurable webhooks. Filter by severity, station group, or fault type.
See Your Network's Health in Real Time
We'll connect a demo network and walk through the NOC dashboard live — using real OCPP data from simulated stations.